Linux Network and Communication Commands: ping, traceroute, netstat and More
Follow a connection from an application to a remote server, then use each command as evidence for one layer instead of treating a single result as the whole diagnosis.
Linux Fundamentals for IT & Network Engineers
Each part adds a practical administration skill used in NOC, network, cloud and server roles.
In This Lesson
Build the layered network model, learn five classic commands, then apply the evidence to a website outage without overclaiming what any one test proves.
Quick Learning Map
Use tests that move from the nearest dependency to the farthest, then return to the application layer.
Prove the local path
Confirm the interface, route and gateway before blaming the WAN.
Trace the network
Use ICMP and hop evidence to narrow the failure domain without treating silence as proof.
Inspect the service
Check sockets, ports, DNS, TLS and the application after basic forwarding is understood.
Linux Network Troubleshooting Flow
Network troubleshooting is a chain of evidence. ping samples reachability and latency, traceroute explores the Layer-3 path, and netstat inspects the local host's connections and listeners.
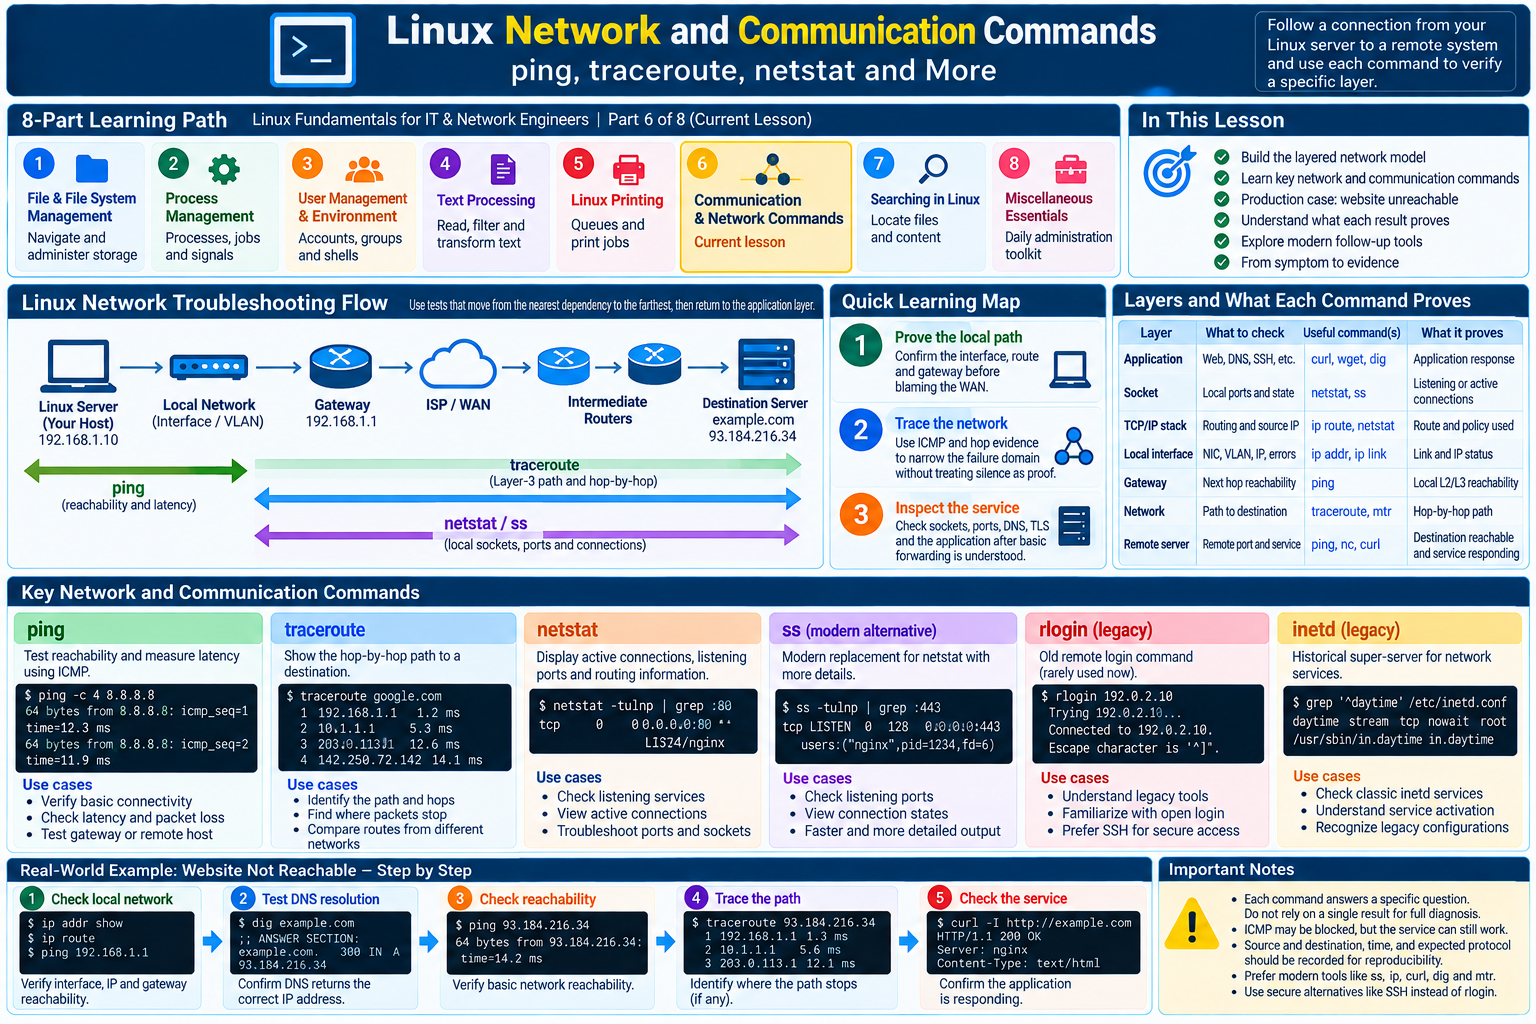
The Linux Network Troubleshooting Path
Start at the symptom and walk outward. A healthy lower layer is necessary for the next layer, but it is not proof that every higher layer works.
- ApplicationThe client builds a request and may depend on configuration, DNS, credentials, TLS and an upstream service. A web process can fail even when the network is perfect.
- SocketThe process asks the kernel for a TCP or UDP endpoint. Local address, port, state and owning process reveal whether the expected service is actually listening or connecting.
- TCP/IP stackThe kernel selects a route, source address and transport behavior. Routing tables, policy rules, local firewalls and connection state all matter here.
- Local interfaceThe NIC, VLAN, address, prefix and link state must support the selected next hop. Interface errors or a wrong prefix can stop traffic locally.
- GatewayThe host must resolve and reach its next hop on the local network. Gateway reachability proves a local Layer-2/Layer-3 exchange, not Internet access.
- NetworkCampus, ISP, WAN, VPN, firewall and intermediate routing policies carry or filter the packets. Forward and return paths may differ.
- Remote serverThe destination must accept the intended protocol and the application behind it must answer correctly. ICMP reachability alone does not establish this.
Linux Network and Communication Command Reference
These commands span service activation, local socket state, ICMP reachability, legacy remote login and hop-by-hop path discovery.
netstat, rlogin and traditional inetd remain important to recognize, but modern Linux operations commonly use newer socket, service-management and encrypted-access tools.inetd — the historical Internet super-server
Purpose: inetd listens on behalf of several small network services and starts the configured server program when a connection arrives. It historically reduced the need for many idle daemons.
Syntax and configuration:
# Inspect classic configuration
grep -v '^[[:space:]]*#' /etc/inetd.conf

# Ask a SysV-style service manager to reload configuration
sudo service inetd reload
Important fields: service name, socket type such as stream or dgram, protocol, wait behavior, run-as user, server path and arguments. Implementations vary; some use xinetd or a different configuration layout.
Troubleshooting example and output:
$ grep '^daytime' /etc/inetd.conf
daytime stream tcp nowait root internal

$ netstat -ltn | grep ':13 '
tcp  0  0  0.0.0.0:13  0.0.0.0:*  LISTEN
Interpretation: the configuration enables the TCP daytime service and a local listener exists on port 13. This does not prove that a firewall permits remote access or that the service returns correct data.
Limitations and modern alternative: many modern distributions do not install or use classic inetd. Service managers and socket-activation systems, especially systemd socket units, are common alternatives. Check the deployed distribution rather than assuming a particular manager.
netstat — inspect local sockets, listeners and network statistics
Purpose: netstat correlates local and remote addresses, TCP state, listeners, routes and interface statistics. It remains widely recognized and useful during troubleshooting, but is considered legacy on many modern Linux systems.
Syntax: netstat [OPTIONS]. Common options are -l listening sockets, -a all sockets, -t TCP, -u UDP, -n numeric addresses, -p process/PID where permitted, -r routes and -i interfaces.
Real troubleshooting example:
$ sudo netstat -lntp | grep ':443 '
tcp  0  0  0.0.0.0:443  0.0.0.0:*  LISTEN  1842/nginx

$ netstat -nt | grep '203.0.113.20:443'
tcp  0  0  10.20.30.15:48622  203.0.113.20:443  ESTABLISHED
Interpretation: Nginx owns a TCP listener on all IPv4 addresses at port 443, and one outbound or proxied TCP session is established to 203.0.113.20:443. LISTEN proves a kernel socket, not a healthy HTTP response; ESTABLISHED proves the TCP handshake and current state, not correct application data.
Limitations: process details may require elevated privileges, short-lived sockets can disappear between samples, containers and network namespaces can hide sockets from the current namespace, and output is host-local.
Modern alternative: ss -lntp from iproute2 is commonly preferred because it is faster and exposes richer socket details. This lesson retains netstat because it is requested and still appears in runbooks and interviews.
ping — sample IP reachability, RTT and packet loss
Purpose: ping sends ICMP Echo Request messages and measures matching ICMP Echo Reply messages. It reports round-trip time (RTT) and observed loss across the test interval.
Syntax: ping [OPTIONS] DESTINATION. Useful options include -c COUNT, -W TIMEOUT, -i INTERVAL, -I INTERFACE_OR_SOURCE, -4, -6 and -s PAYLOAD_SIZE. Privilege requirements vary by system.
Gateway test:
$ ping -c 4 -W 2 10.20.30.1
PING 10.20.30.1 (10.20.30.1) 56(84) bytes of data.
64 bytes from 10.20.30.1: icmp_seq=1 ttl=64 time=0.421 ms
64 bytes from 10.20.30.1: icmp_seq=2 ttl=64 time=0.388 ms
64 bytes from 10.20.30.1: icmp_seq=3 ttl=64 time=0.402 ms
64 bytes from 10.20.30.1: icmp_seq=4 ttl=64 time=0.395 ms

--- 10.20.30.1 ping statistics ---
4 packets transmitted, 4 received, 0% packet loss, time 3067ms
rtt min/avg/max/mdev = 0.388/0.401/0.421/0.012 ms
Interpretation: four replies show bidirectional ICMP reachability to the gateway during this sample. Average RTT was about 0.4 ms and no test packet was lost. It does not prove Internet routing, DNS, TCP/443, or website health.
Failure output:
$ ping -c 3 198.51.100.40
PING 198.51.100.40 (198.51.100.40) 56(84) bytes of data.

--- 198.51.100.40 ping statistics ---
3 packets transmitted, 0 received, 100% packet loss, time 2041ms
Limitations: failure means no Echo Reply returned before timeout; it does not automatically mean the host is down because ICMP may be filtered, rate-limited or deprioritized. Success also does not prove the application is healthy. ICMP packets may follow different policy from application traffic, and a short sample can miss intermittent loss.
Modern complements: use mtr for repeated path/loss sampling and test the real service with tools such as curl or nc.
rlogin — recognize a legacy remote-login client
Purpose: rlogin opens a remote login session using the historical rlogin protocol, commonly associated with TCP port 513 and host-based trust.
Syntax: rlogin [-l USER] HOST. Common historical forms are rlogin host and rlogin -l operator host.
Legacy lab output:
$ rlogin -l operator legacy-router.lab
legacy-router.lab: Connection refused
Interpretation: a TCP connection attempt was actively rejected, often because nothing is listening or a firewall sent a reject. It does not identify which device rejected it, and it is not a reason to enable rlogin.
rlogin is legacy and insecure because it was designed without modern encrypted-session protections. Do not use it for modern production administration or expose it to untrusted networks.Limitations and secure alternative: trust based on host names or files such as .rhosts is unsafe, and session confidentiality and modern server authentication are absent. SSH is the normal secure alternative: ssh [email protected]. Use keys, host-key verification and current cryptographic policy.
traceroute — explore the Layer-3 path hop by hop
Purpose: traceroute sends probes with increasing IP Time To Live (TTL) values. A router decrements TTL; when it reaches zero, the router may return an ICMP Time Exceeded message. Those replies reveal a forward-path sequence of responding hops.
Syntax: traceroute [OPTIONS] DESTINATION. Useful options include -n numeric output, -m MAX_HOPS, -w WAIT, -q PROBES, -I ICMP Echo probes, -T TCP SYN probes and -p PORT. Options and privilege requirements vary by implementation.
Real troubleshooting example:
$ traceroute -n -q 3 -w 2 203.0.113.20
traceroute to 203.0.113.20, 30 hops max, 60 byte packets
 1  10.20.30.1       0.421 ms  0.398 ms  0.405 ms
 2  172.16.4.1       2.832 ms  2.761 ms  2.944 ms
 3  *                 *         *
 4  198.51.100.9     18.402 ms 18.771 ms 18.530 ms
 5  203.0.113.20     21.108 ms 20.994 ms 21.242 ms
Interpretation: the destination responded at hop 5, so the probes completed despite hop 3 showing * * *. The silent router may forward traffic normally while filtering or rate-limiting TTL-expired replies.
Limitations: the displayed path is based on responding probes, not a complete physical map. Load balancing can produce different addresses across probes. Forward and return routes may be asymmetric, so RTT includes an unknown return path. Firewalls may filter UDP, ICMP or TCP probes differently. Asterisks do not automatically mean the path is broken; persistent loss beginning at a hop matters only when later hops and the destination also fail under comparable tests.
Modern complements: mtr combines repeated tracing with statistics, while tracepath can discover path characteristics without some privileged modes. TCP traceroute toward the real service port may better match firewall policy, but still is not an application test.
Production Case: Website Is Not Reachable from a Linux Server
Assume a monitoring server at 10.20.30.15 cannot open https://app.example.net, whose resolved address is 203.0.113.20. Preserve the DNS result and exact timestamp, then move outward.
- 1. Ping the local gateway
ping -c 4 10.20.30.1. Replies support that the selected local interface, local subnet exchange and gateway ICMP return path worked during the sample. They do not prove the default route is correct for the destination, the WAN is available, or the website works. No reply can indicate a local link, VLAN, address, neighbor, firewall or gateway problem, but ICMP filtering prevents a definite conclusion. - 2. Ping the destination
ping -c 4 203.0.113.20. Replies establish an ICMP round trip to that address and provide sampled RTT/loss. They do not test DNS naming, TCP/443, TLS, virtual-host routing or HTTP. No reply does not prove the server is down; continue because the endpoint may filter ICMP. - 3. Trace the destination
traceroute -n 203.0.113.20. A completed trace shows a sequence of responding Layer-3 hops for those probes. A trace that stops after the gateway narrows attention toward routing, upstream policy or filtered probes, but cannot by itself identify the failed device. Individual* * *rows are not proof of loss when later hops answer. Consider asymmetric routing and try a probe type that resembles the real service. - 4. Investigate local sockets
netstat -ntpornetstat -s. RepeatedSYN_SENTentries toward203.0.113.20:443show that the local TCP stack is trying without completing the handshake.ESTABLISHEDmeans TCP connected, not that TLS or HTTP succeeded. For an inbound website,netstat -lntp | grep ':443 'confirms only the local listener and owning process. - 5. Investigate the application layerVerify name resolution, then test the actual protocol:
curl -v --connect-timeout 5 https://app.example.net/. Separate DNS, TCP connect, TLS certificate/handshake, HTTP status, proxy, web-server logs and backend health. Only this stage can establish whether the requested application transaction works.
Annotated failure evidence
$ netstat -nt | grep '203.0.113.20:443'
tcp  0  1  10.20.30.15:48622  203.0.113.20:443  SYN_SENT
# SYN_SENT: the client sent a SYN, but this snapshot has no completed handshake.

$ curl -v --connect-timeout 5 https://app.example.net/
*   Trying 203.0.113.20:443...
* connect to 203.0.113.20 port 443 failed: Connection timed out
# The application test reached the TCP-connect stage and timed out before TLS.
This combination supports a TCP reachability or policy problem on port 443, but packet capture or firewall telemetry is needed to prove whether the SYN left, where it was dropped, and whether a reply returned.
What the Troubleshooting Evidence Can and Cannot Prove
| Checkpoint | Positive evidence supports | It does not prove |
|---|---|---|
| Gateway ping | A sampled local ICMP round trip to the next hop | WAN reachability, DNS or application health |
| Destination ping | A sampled ICMP round trip and RTT/loss observation | TCP/443, TLS, HTTP or backend health |
| Traceroute completes | Responding hop sequence for the selected probes | Symmetric routing, every physical hop or application success |
Traceroute shows * * * | No reply arrived for those probes before timeout | That the router stopped forwarding traffic |
netstat shows LISTEN | A local socket accepts connection attempts on an address/port | Firewall access or a correct application response |
netstat shows ESTABLISHED | The TCP connection reached established state | Successful TLS, authentication or business transaction |
curl receives expected content | The tested DNS/TCP/TLS/HTTP path worked at that time | All users, regions, backends or future requests are healthy |
Modern Linux Networking Follow-Up Toolkit
ss
Preferred socket inspection on many modern systems: ss -lntp for listeners and ss -nt state syn-sent for pending TCP connects.
ip
Inspect links, addresses, routes and neighbor state with ip link, ip address, ip route get and ip neigh.
mtr and tracepath
Use repeated path sampling or a lightweight path/MTU view while respecting ICMP rate limiting and asymmetric routes.
dig
Verify the name, record type, resolver response and selected destination instead of assuming DNS is correct.
curl and nc
Test the actual HTTP/TLS transaction with curl or a specific TCP/UDP port with nc.
tcpdump
Capture packets at a chosen interface to verify whether requests leave and replies return; handle production payloads and credentials carefully.
Linux Network and Communication Commands Frequently Asked Questions
Does a successful ping prove that a website is healthy?
No. A ping reply confirms an ICMP exchange with an address. It does not test DNS correctness, TCP port 80 or 443, TLS, the web server, or the application.
Does ping failure mean the host is down?
Not always. A host or firewall may filter ICMP while allowing application traffic. Test the required application protocol before declaring the host unavailable.
Why does traceroute show asterisks?
Asterisks mean no reply arrived before the timeout for those probes. A router may suppress or rate-limit TTL-expired replies even while forwarding traffic normally.
Should I use netstat or ss on modern Linux?
netstat remains useful and widely recognized, but it is legacy on many current systems. The iproute2 ss command is commonly preferred for socket inspection.
Is rlogin safe to use on a production network?
No. rlogin was designed without modern encrypted-session protections. Use SSH for normal secure remote administration.
What was inetd used for?
inetd was an Internet super-server that listened for several network services and started the appropriate server program on demand. Many modern distributions use other service-management or socket-activation approaches.